


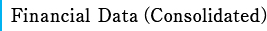
Operating revenue
| 2019.3 | 2020.3 | 2021.3 | 2022.3 | 2023.3 | |
|---|---|---|---|---|---|
| Leasing | 30,917 | 32,828 | 33,544 | 33,038 | 33,475 |
| Facility management | 9,186 | 9,146 | 8,661 | 8,162 | 8,512 |
| Other buisinesses | 534 | 842 | 703 | 658 | 696 |
| Total | 40,637 | 42,817 | 42,909 | 41,859 | 42,683 |
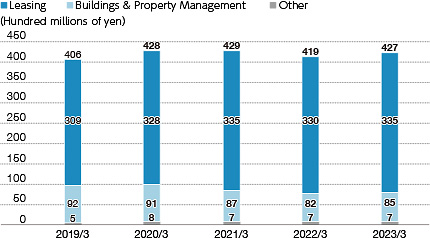
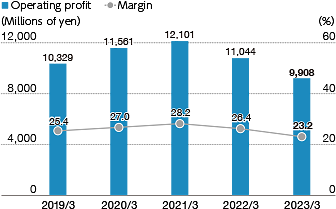
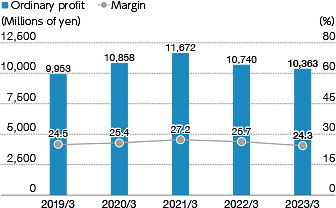
Operating profit, Ordinary profit & Profit attributable to owners of parent
| 2019.3 | 2020.3 | 2021.3 | 2022.3 | 2023.3 | |
|---|---|---|---|---|---|
| Operating profit | 10,329 | 11,561 | 12,101 | 11,044 | 9,908 |
| Ordinary profit | 9,953 | 10,858 | 11,672 | 10,740 | 10,363 |
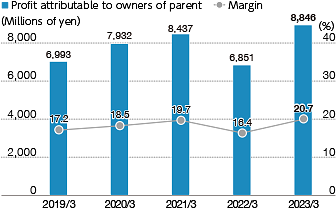
| Profit attributable to owners of parent | 6,993 | 7,932 | 8,437 | 6,851 | 8,846 |
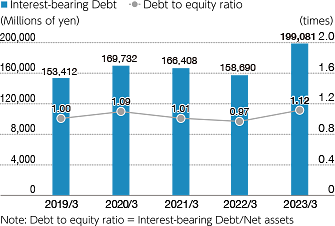
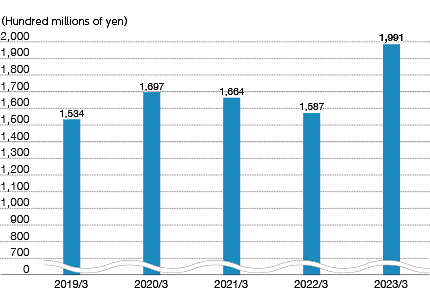
Interest-bearing Debt
| 2019.3 | 2020.3 | 2021.3 | 2022.3 | 2023.3 | |
|---|---|---|---|---|---|
| Interest-bearing Debt | 153,412 | 169,732 | 166,408 | 158,690 | 199,081 |
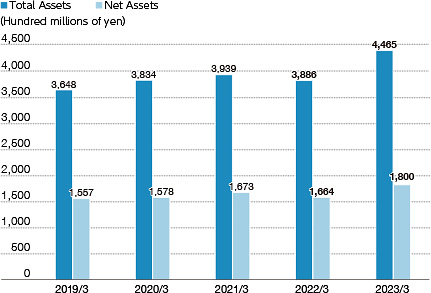
Total Assets & Net Assets
| 2019.3 | 2020.3 | 2021.3 | 2022.3 | 2023.3 | |
|---|---|---|---|---|---|
| Total Assets | 364,754 | 383,426 | 393,928 | 388,645 | 446,544 |
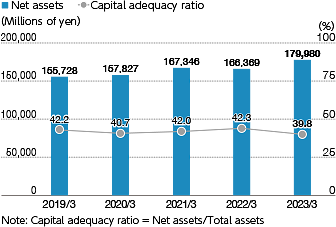
| Net Assets | 155,728 | 157,827 | 167,346 | 166,369 | 179,980 |
※We have applied the “Accounting Standard for Revenue Recognition”(ASBJ Statement No.29)and
relevant Guidance from the fiscal 2021.

■Operating profit / Margin
■Ordinary profit / Margin
■Profit attributable to owners of parent / Margin
■Net Assets / Capital adequacy ratio
■Interest-bearing Debt / Debt to Equity Ratio